Set series values from data encoded in a separator-delimited string.
object.SetSeriesValuesFromString index, values
Arguments
- object
- Required. A Chart object.
- index
- Required. An integer value that specifies the zero-based index of the series in the chart object.
- values
- Required. A string that specifies the data (see SetSeparators).
Remarks
You can set the data values of a specified series in a chart with data encoded in a string (i.e. the values argument). The string must be formatted as a list of numerical values, two consecutive values must be separated by a separator character that can be specified with the SetSeparators method.
Here is an example of series values encoded in a string with the character ";" as separator.
myEncodedString= "12;7.5;11.3;9.2;5.3"
The string argument values is parsed by the chart object according to the separator characters specified to the chart object (see the SetSeparators method for specifying separator characters and rules).
The ";" character is the default separator character.
If the index argument refers to a series that does not exist in the chart object, the series is created.
- index must be superior or equal to 0.
VBScript Sample Code
The following VBScript code shows how to store the series and categories of the table below using the SetSeriesValuesFromString method. This table has two series named "Year 2006" and "Year 2007". The categories are "North America", "South America", "Europe", "Middle East" and "Asia".
|
||||||||||||||||||
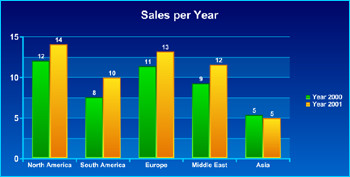 |
'Let's build the series and categories string with ";" as separator
sep= ";"
ignoremultseparators= true

'Before setting the series and categories, we must specify the separators
chart.SetSeparators sep, ignoremultseparators

myString= "North America" & sep & "South America" & sep & "Europe" & sep & "Middle East" & sep & "Asia"

'Fill the chart with the categories stored in the myString variable
chart.SetCategoriesFromString myString

'Add the first series "Year 2006"
myString= "12" & sep & "7.5" & sep & "11.3" & sep & "9.2" & sep & "5.3"

'Fill the first series with the data stored in the myString variable
chart.SetSeriesCaption 0, "Year 2006"
chart.SetSeriesValuesFromString 0, myString

'Do the same way for the second series "Year 2007"
See Also
GetSeriesCount Method | SetSeriesValuesFromArray Method | SetSeriesCaption Method | GetSeriesValue Method
Applies To: Chart Object