Set series Y values from data stored in a single-dimension array (for XY-Scatter and XY-Curves).
void object.SetSeriesYValuesFromArray( int index, String[] values )
void object.SetSeriesYValuesFromArray( int index, int[] values )
void object.SetSeriesYValuesFromArray( int index, float[] values )
void object.SetSeriesYValuesFromArray( int index, double[] values )
Arguments
- object
- Required. A Chart object.
- index
- Required. An integer value that specifies the zero-based index of the series in the chart object.
- values
- Required. A single-dimension array containing the series Y values as elements (String, int, float or double).
Remarks
Note: This method is available when manipulating XY data series required for displaying XY-Curves and XY-Scatter. Note that the Chart type (ie: bar, column, line, etc.) is defined in the Swiff Chart style file (.scs) which must be loaded via the LoadStyle method.
The data stored in the array must be numerical values.
If the index argument refers to a series that does not exist in the chart object, the series is created.
- index must be superior or equal to 0.
JSP Sample Code
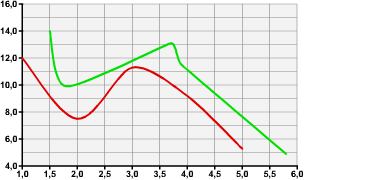
The following JSP code shows how to store the XY values of the table below using the SetSeriesYValuesFromArray method. This table has two series named "Year 2006" and "Year 2007". Each of these two series contains independant X values and Y values.
|
|
||||||||||||||||||||||||||||
float[] array_x= new float[5];
float[] array_y= new float[5];

array_x[0]= 1.0f;
array_x[1]= 2.0f;
array_x[2]= 3.0f;
array_x[3]= 4.0f;
array_x[4]= 5.0f;

array_y[0]= 12.0f;
array_y[1]= 7.5f;
array_y[2]= 11.3f;
array_y[3]= 9.2f;
array_y[4]= 5.3f;

// Add the first series "Year 2006"
chart.SetSeriesCaption( 0, "Year 2006" );

// Fill the first series with XY values stored in the array variables
chart.SetSeriesXValuesFromArray( 0, array_x );
chart.SetSeriesYValuesFromArray( 0, array_y );

array_x[0]= 1.5f;
array_x[1]= 1.8f;
array_x[2]= 3.7f;
array_x[3]= 3.9f;
array_x[4]= 5.8f;

array_y[0]= 14.0f;
array_y[1]= 9.9f;
array_y[2]= 13.1f;
array_y[3]= 11.5f;
array_y[4]= 4.9f;

// Add the first series "Year 2007"
chart.SetSeriesCaption( 1, "Year 2007" );

// Fill the second series with XY values stored in the array variables
chart.SetSeriesXValuesFromArray( 1, array_x );
chart.SetSeriesYValuesFromArray( 1, array_y );
See Also
GetSeriesCount Method | SetSeriesYValuesFromString Method | SetSeriesCaption Method | GetSeriesYValue Method
Applies To: Chart Object