Swiff Chart Generator & Swiff Chart
Swiff Chart Generator runs in conjunction with Swiff Chart, the desktop chart authoring tool for creating chart templates. Chart templates (aka chart styles) include all the graphical, layout and format parameters for all individual chart elements
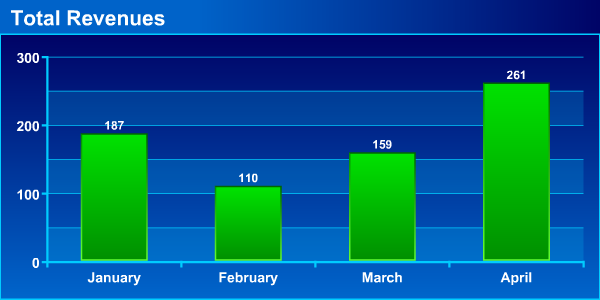
In the simple example below, the chart is created using one of the predefined chart templates distributed with Swiff Chart Generator.
For more information about Swiff Chart see How to specify chart format and layout parameters.
Data and Result
Let's take as an example the following data and make the following animated chart.
| January | February | March | April | |
|---|---|---|---|---|
| Total Revenues | 187 | 110 | 159 | 261 |
How to generate the chart in ASP.NET C#
The chart above can be dynamically generated with the following ASP.NET 2.0 code and page.
ASP.NET 2.0 page: SampleWebForm.aspx.cs
using GlobFX.SwiffChartGenerator;
public partial class SampleWebForm : System.Web.UI.Page
{
private void Page_Load(object sender, System.EventArgs e)
{
// Set the heading for the graph
chart.Title= "My Chart";
// Set chart categories
chart.SetCategoriesFromArray( new string[] { "Q1", "Q2", "Q3" } );
// Fill chart series
chart.SetSeriesCaption( 0, "First Series" );
chart.SetSeriesValuesFromArray( 0, new double[] { 1.2, 3.5, 11.3 } );
chart.SetSeriesCaption( 1, "Second Series" );
chart.SetSeriesValuesFromArray( 1, new double[] { 2.3, 4.5, 9.3 } );
chart.SetSeriesCaption( 2, "Third Series" );
chart.SetSeriesValuesFromArray( 2, new double[] { 3.2, 5.5, 14.3 } );
// Apply a Column style
// The chart type is stored in the style file (*.scs)
// Here the selected style is the predefined column style "SanFrancisco"
chart.LoadStyle( @"column\SanFrancisco" );
// Set the dimensions of the movie
chart.Width= 400;
chart.Height= 200;
}
}
ASP.NET 2.0 page: SampleWebForm.aspx
<%@ Register TagPrefix="globfx" Namespace="GlobFX.SwiffChartGenerator" Assembly="GlobFX.SwiffChartGenerator" %>
<!DOCTYPE html PUBLIC "-//W3C//DTD XHTML 1.0 Transitional//EN" "http://www.w3.org/TR/xhtml1/DTD/xhtml1-transitional.dtd">
<html xmlns="http://www.w3.org/1999/xhtml" >
<head runat="server">
<title>Sample Chart</title>
</head>
<body>
<form id="form1" runat="server">
<div>
<globfx:Chart id="chart" runat="server" Height="200px" Width="400px"></globfx:Chart>
</div>
</form>
</body>
</html>
How to generate the chart in ASP VBScript
The chart above can be dynamically generated with the following VBScript code:
<% @Language=VBScript %>
<%
  ' Create a Chart Object
  Dim chart
  Set chart= Server.CreateObject("SwiffChartObject.ChartObj")

  ' Set dynamic data
  chart.SetTitle "Total Revenues"
  chart.SetCategoriesFromString "January;February;March;April"
  chart.SetSeriesValuesFromString 0, "187;110;159;261"

  ' Load a chart template (aka chart style).
  ' The chart template contains all the format and layout parameters of the chart.
  ' Use Swiff Chart authoring tool to edit a custom chart template.
  chart.LoadStyle "column\SanFrancisco"

  ' Finally generate the chart
  Response.Write chart.GetHTMLTag
  Set chart= Nothing
%>
How to generate the chart in PHP
The chart above can be dynamically generated with the following PHP code:
<?php
  // Create a Chart Object
  require("SwiffChart.php");

  $chart= new SwiffChart;

  // Set dynamic data
  $chart->SetTitle("Total Revenues");
  $chart->SetCategoriesFromString("January;February;March;April");
  $chart->SetSeriesValuesFromString( 0, "187;110;159;261" );

  // Load a chart template (aka chart style).
  // The chart template contains contains all the format and layout parameters of the chart.
  // Use Swiff Chart authoring tool to edit a custom chart template.
  $chart->LoadStyle("column/SanFrancisco");

  // Finally generate the chart
  echo $chart->GetHTMLTag();
?>
How to generate the chart in JSP
The chart above can be dynamically generated with the following JSP code:
<!DOCTYPE HTML PUBLIC "-//W3C//DTD HTML 4.01 Transitional//EN" "http://www.w3.org/TR/html4/loose.dtd">

<html>
<head>
  <title>Chart Sample</title>
</head>
<body>

<%@page language="java"%>
<%@page import="com.globfx.swiffchart.SwiffChart" %>
<%
  String install_dir= "/usr/local/SwiffChart";

  SwiffChart chart= new SwiffChart(install_dir);

  chart.SetDocumentRoot( getServletContext().getRealPath("/") );
  chart.SetAppRootUrl(request.getContextPath());
  chart.SetServletInfo(request,response);

  // Set dynamic data
  chart.SetTitle("Total Revenues");
  chart.SetCategoriesFromString("January;February;March;April");
  chart.SetSeriesValuesFromString( 0, "187;110;159;261" );

  // Load a chart template (aka chart style).
  // The chart template contains contains all the format and layout parameters of the chart.
  // Use Swiff Chart authoring tool to edit a custom chart template.
  chart.LoadStyle("column/SanFrancisco");

  // Finally generate the chart and release the object
  out.println( chart.GetHTMLTag() );

  chart.Release();
%>

</body>
</html>
How to generate the chart from command line
The chart above can be dynamically generated with the following command line:
Windows:
C:\> swfchart.exe /O sample.swf /S column\SanFrancisco /T "Total Revenues" /D ";" /C "January;February;March;April" /N "187;110;159;261"

where:
  /O  specifies the output filename of the generated chart
  /S  specifies the chart style name (or direct filename)
  /T  specifies the chart title
  /D  specifies the delimiters to use
  /C  specifies the categories names (separators-delimited)
  /N  specifies the data series (separators-delimited)

Data may also be read from a file:

C:\> swfchart.exe /S column\SanFrancisco /D ";" /O sample.swf C:\data.txt
Unix:
$ swfchart -o sample.swf -s column/SanFrancisco -t "Total Revenues" -d ";" -c "January;February;March;April" -n "187;110;159;261"

where:
  -o  specifies the output filename of the generated chart
  -s  specifies the chart style name (or direct filename)
  -t  specifies the chart title
  -d  specifies the delimiters to use
  -c  specifies the categories names (separators-delimited)
  -n  specifies the data series (separators-delimited)

Data may also be read from a file:

$ swfchart -s column/SanFrancisco -d ";" -o sample.swf /home/user/data.txt