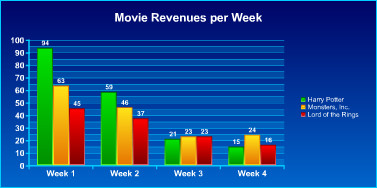
This example creates a chart using data specified in strings. Tab-delimited strings are set to the category and value data, and then these strings are used with the SetCategoriesFromString and SetSeriesValuesFromString methods to set the chart data. The image below is a snapshot of the resulting chart.
To run this example, copy the remainder of the text in this topic into an ASP page.
 <%@ LANGUAGE="VBSCRIPT" %>

 <%
    Dim categories, values, chart

    ' Create a column chart with three series and four categories, showing the
    ' first 4 weeks revenues in million $ of 3 movies "Harry Potter",
    ' "Monsters, Inc." and "Lord of the Rings".

    ' Set a tab-delimited string to the category data
    ' The categories will be the same for all three series.
    categories= "Week 1" & Chr(9) & "Week 2" & Chr(9) & "Week 3" & Chr(9) & "Week 4"

    ' Create a new Swiff Chart object.
    Set chart= Server.CreateObject("SwiffChartObject.ChartObj")

    ' Specify that the tab character is the separator.
    chart.SetSeparators Chr(9), true

    ' Set the categories for all the series
    chart.SetCategoriesFromString categories

    ' Series one contains revenues data for "Harry Potter".
    ' Set the series caption (the text that appears in the legend).

    values= "93.5" & Chr(9) & "58.5" & Chr(9) & "21.0" & Chr(9) & "14.8"

    chart.SetSeriesCaption 0, "Harry Potter"
    chart.SetSeriesValuesFromStrings 0, values

    ' Series two contains revenues data for "Monsters, Inc.".
    ' Set the series caption (the text that appears in the legend).

    values= "63.4" & Chr(9) & "46.2" & Chr(9) & "23.0" & Chr(9) & "24.3"

    chart.SetSeriesCaption 1, "Monsters, Inc."
    chart.SetSeriesValuesFromString 1, values

    ' Series three contains revenues data for "Lord of the Rings".
    ' Set the series caption (the text that appears in the legend).

    values= "45.3" & Chr(9) & "37.3" & Chr(9) & "23.0" & Chr(9) & "16.2"

    chart.SetSeriesCaption 2, "Lord of the Rings"
    chart.SetSeriesValuesFromString 2, values

    ' Set the chart title to "Movie Revenues per Week".
    chart.SetTitle "Movie Revenues per Week"

    ' Set the chart graphical layout with a Swiff Chart style file.
    chart.LoadStyle "C:\Program Files\GlobFX\Swiff Chart Generator 4\styles\column\SanFrancisco.scs"

    ' Finally generate the Flash chart into the Response object.
    chart.ExportAsResponse

    ' Release the chart object
    Set chart= Nothing

    Response.End
 %>
See Also
Creating a Chart Using Data Specified in Arrays
Creating a Chart Using Data From a Text File
Creating a Chart Using Data Specified in URLs
Creating a Chart Using Data From an ADO Recordset