Swiff Chart Generator is implemented as a COM object and offers a variety of methods for managing and creating charts in Flash. Since COM objects are natively supported in ASP, running Swiff Chart Generator in your ASP pages is very simple.
To insert a chart in a ASP page you must call the CreateObject function available in VScript as well as in JScript. By calling this function you will create an instance of the Swiff Chart Generator COM object and have full access to its API (Read VBScript and JScript Reference manual of Swiff Chart Generator documentation for complete description of the API).
How does Swiff Chart Generator work in ASP pages?
Swiff Chart Generator offers you multiple possibilities to dynamically generate a chart. It allows you to:
- Send the chart directly through the Response object
- Export the chart in binary form
- Create a SWF file on disk
- or even feed your chart with data encoded in the page URL
One of the most straight forward strategy for dynamically generating a chart with Swiff Chart Generator
consists in using 2 pages:
- The first page is an ASP page that generates and outputs a Flash movie containing your chart through the Response ASP object.
- The second page is the one where you want to display your chart. It can be an HTML page or a ASP generated page and it includes the Flash Player with the <OBJECT> HTML tag. The idea is to simply set the movie parameter of the Flash Player Object to the ASP page filename:
<OBJECT CLASSID="clsid:D27CDB6E-AE6D-11cf-96B8-444553540000"
        WIDTH="400"
        HEIGHT="200">
   <PARAM NAME=movie VALUE="gen_chart.asp">
</OBJECT>
A simple ASP Example
The following example illustrates how simple it is to dynamically generate charts in Flash in a ASP page. As mentioned in the previous paragraph, the example involves 2 files and an additional Swiff Chart style file (.scs):
- gen_chart.asp - ASP page for generating the chart
- chart.html - HTML file for displaying the chart
To install and run this example, copy these 2 files on your Web site in the same directory.
ASP page: gen_chart.asp
<% @Language=VBScript %>
<%
Response.Expires= 0
' Create a Chart Object
Dim chart
Set chart= Server.CreateObject("SwiffChartObject.ChartObj")
' Set the heading for the graph
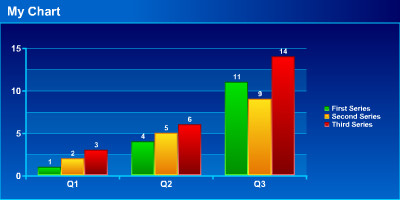
chart.SetTitle "My Chart"
' Set chart categories
chart.SetCategoriesFromString "Q1;Q2;Q3"
' Fill chart series
chart.SetSeriesCaption 0, "First Series"
chart.SetSeriesValuesFromString 0, "1.2;3.5;11.3"
chart.SetSeriesCaption 1, "Second Series"
chart.SetSeriesValuesFromString 1, "2.3;4.5;9.3"
chart.SetSeriesCaption 2, "Third Series"
chart.SetSeriesValuesFromString 2, "3.2;5.5;14.3"
' Apply a Column style
' The chart type is stored in the style file (*.scs)
' Here the selected style is the predefined column style "SanFrancisco"
chart.LoadStyle "column/SanFrancisco"
' Set the dimensions of the movie
chart.SetWidth 400
chart.SetHeight 200
' Finally generate the Flash chart
chart.ExportAsResponse
' Release the chart object
Set chart= Nothing
Response.End
%>
HTML file: chart.html
<HTML>
<HEAD>
<TITLE>Swiff Chart Generator - ASP Sample</TITLE>
</HEAD>

<BODY BGCOLOR="#FFFFFF" TEXT="#000000">

<OBJECT CLASSID="clsid:D27CDB6E-AE6D-11cf-96B8-444553540000"
        CODEBASE="http://download.macromedia.com/pub/shockwave/cabs/flash/swflash.cab#version=6,0,29,0"
        WIDTH="400"
        HEIGHT="200">
  <PARAM NAME=movie VALUE="gen_chart.asp">
  <PARAM NAME=quality VALUE=high>
  <EMBED SRC="gen_chart.asp"
         QUALITY=high
         PLUGINSPAGE="http://www.adobe.com/shockwave/download/index.cgi?P1_Prod_Version=ShockwaveFlash"
         TYPE="application/x-shockwave-flash"
         WIDTH="400"
         HEIGHT="200">
  </EMBED>
</OBJECT>

</BODY>
</HTML>
What you will obtain