Namespace: GlobFX.SwiffChartGenerator
Assembly: GlobFX.SwiffChartGenerator (in GlobFX.SwiffChartGenerator.dll)
Set series Z values (bubble sizes) from data stored in a single-dimension array (for Bubble charts).
Public Sub SetSeriesZValuesFromArray( index As Integer, values As Array )
public void SetSeriesZValuesFromArray( int index, Array values );
Arguments
- index
- An integer value that specifies the zero-based index of the series in the chart object.
- values
- A single-dimension array containing the series Z values (or bubble sizes) as elements: double[], string[], DateTime[], int[], float[], byte[], sbyte[], short[], ushort[], uint[], long[], or ulong[].
Remarks
Note: This method is available when manipulating Bubble data series required for displaying Bubble charts. Note that the Chart type (bubble, bar, column, line, etc) is defined in the Swiff Chart style file (.scs) which must be loaded via the LoadStyle method.
The data stored in the array must be numerical values.
If the index argument refers to a series that does not exist in the chart object, the series is created.
- index must be superior or equal to 0.
Sample Code
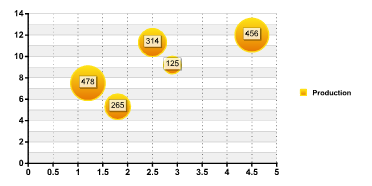
The following code shows how to store the XY and Sizes values of the table below using the SetSeriesZValuesFromArray method. This table has one series named "Production". This series contains independant XY and Sizes values.
|
|
|||||||||||||||||||||
Dim array_x(4) As Double
Dim array_y(4) As Double
Dim array_z(4) As Double

array_x(0)= 1.0
array_x(1)= 2.0
array_x(2)= 3.0
array_x(3)= 4.0
array_x(4)= 5.0

array_y(0)= 12.0
array_y(1)= 7.5
array_y(2)= 11.3
array_y(3)= 9.2
array_y(4)= 5.3

array_z(0)= 456.0
array_z(1)= 478.0
array_z(2)= 314.0
array_z(3)= 125.0
array_z(4)= 265.0

' Add the first series "Production"
chart.SetSeriesCaption( 0, "Production" )

' Fill the first series with XY values stored in the array variables
chart.SetSeriesXValuesFromArray( 0, array_x )
chart.SetSeriesYValuesFromArray( 0, array_y )

' Fill the first series with Bubble Size values stored in the array_z variable
chart.SetSeriesZValuesFromArray( 0, array_z )
double[] array_x= new double[5];
double[] array_y= new double[5];
double[] array_z= new double[5];

array_x[0]= 1.0;
array_x[1]= 2.0;
array_x[2]= 3.0;
array_x[3]= 4.0;
array_x[4]= 5.0;

array_y[0]= 12.0;
array_y[1]= 7.5;
array_y[2]= 11.3;
array_y[3]= 9.2;
array_y[4]= 5.3;

array_z[0]= 456.0;
array_z[1]= 478.0;
array_z[2]= 314.0;
array_z[3]= 125.0;
array_z[4]= 265.0;

// Add the first series "Production"
chart.SetSeriesCaption( 0, "Production" );

// Fill the first series with XY values stored in the array variables
chart.SetSeriesXValuesFromArray( 0, array_x );
chart.SetSeriesYValuesFromArray( 0, array_y );

// Fill the first series with Bubble Size values stored in the array_z variable
chart.SetSeriesZValuesFromArray( 0, array_z );
See Also
SetSeriesXValuesFromArray Method | SetSeriesYValuesFromArray Method | SetSeriesXValuesFromString Method | SetSeriesYValuesFromString Method | GetSeriesXValue Method | GetSeriesYValue Method | SetSeriesCaption Method
Applies To: Chart Object