SAMPLE: Simple XY Line Chart - ColdFusion
The information in this article applies to:
- Swiff Chart Generator 2
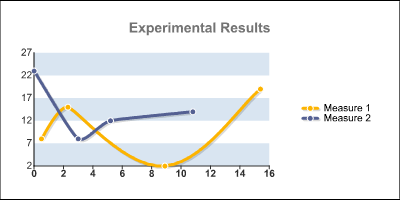
This example illustrates how to generate a simple XY line chart in ColdFusion.
<CFSETTING ENABLECFOUTPUTONLY="Yes" SHOWDEBUGOUTPUT="No">
<CFHEADER NAME= "Expires" VALUE="#Now()#">

<CFOBJECT TYPE="COM"
          NAME="chart"
          CLASS="SwiffChartObject.ChartObj.1"
          ACTION="CREATE">

<CFSCRIPT>
  dirpath = GetDirectoryFromPath( GetBaseTemplatePath() );

  sep= ";";
  ignoremultseparators= true;
  chart.SetSeparators(sep, ignoremultseparators);

  // Fill the first series named "Sales 2001"
  seriesx1= "0.5" & sep & "2.3" & sep & "8.9" & sep & "15.4";
  seriesy1= "8" & sep & "15" & sep & "2" & sep & "19";
  chart.AddSeries();
  chart.SetSeriesXValuesFromString(0, seriesx1);
  chart.SetSeriesYValuesFromString(0, seriesy1);
  chart.SetSeriesCaption(0, "Measure 1");

  // Fill the second series named "Sales 2002"
  seriesx2= "0" & sep & "3" & sep & "5.2" & sep & "10.8";
  seriesy2= "23" & sep & "8" & sep &  "12" & sep & "14";
  chart.AddSeries();
  chart.SetSeriesXValuesFromString(1, seriesx2);
  chart.SetSeriesYValuesFromString(1, seriesy2);
  chart.SetSeriesCaption(1, "Measure 2");

  // Set the chart title
  chart.SetTitle("Experimental Results");

  // Apply a XY Line style
  // The chart type is stored in the style file (*.scs)
  // Here the selected style is the predefined XY line style "Honolulu"
  style = "xy/Honolulu";
  chart.LoadStyle( style );

  chart.SetWidth( 400 );
  chart.SetHeight( 200 );
  chart.SetLooping( false );

  chart_res= chart.GetHTMLTag();
</CFSCRIPT>

<CFOUTPUT>
  <H2>The XY Line Chart</H2>
  <br>#chart_res#
</CFOUTPUT>
| Keywords: | ColdFusion CFML XY Scatter XY Line |