SAMPLE: Simple Column Chart - Java Servlet
The information in this article applies to:
- Swiff Chart Generator 2
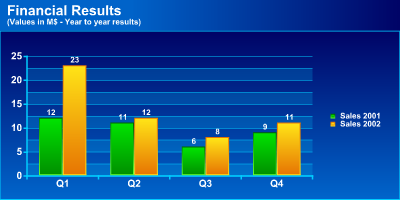
This example illustrates how to generate a simple column chart from a Java Servlet.
import java.io.*;
import javax.servlet.*;
import javax.servlet.http.*;

import com.globfx.swiffchart.SwiffChart;

public class SampleColumnSWF extends HttpServlet
{
  public void doGet( HttpServletRequest request,
                     HttpServletResponse response)
    throws IOException, ServletException
    {
    PrintWriter out= response.getWriter();

    try
      {
      String installation_dir= "/usr/local/SwiffChart";

      SwiffChart chart= new SwiffChart();

      // Required: Specify Swiff Chart Generator installation directory
      chart.SetInstallDir(installation_dir);

      // Required: Initialisation of the chart object
      chart.SetServletInfo(request,response);

      String sep= ";";
      boolean ignoremultseparators= true;
      chart.SetSeparators(sep, ignoremultseparators);

      // Fill the categories
      String categories= "Q1" + sep + "Q2" + sep + "Q3" + sep + "Q4";
      chart.SetCategoriesFromString(categories);

      // Fill the first series named "Sales 2001"
      String series1= "12" + sep + "11" + sep + "6" + sep + "9";
      chart.AddSeries();
      chart.SetSeriesValuesFromString(0, series1);
      chart.SetSeriesCaption(0, "Sales 2001");

      // Fill the second series named "Sales 2002"
      String series2= "23" + sep + "12" + sep + "8" + sep + "11";
      chart.AddSeries();
      chart.SetSeriesValuesFromString(1, series2);
      chart.SetSeriesCaption(1, "Sales 2002");

      // Set the chart title
      chart.SetTitle("Financial Results");
      chart.SetSubtitle("(Values in M$ - Year to year results)");

      // Apply a Column style
      // The chart type is stored in the style file (*.scs)
      // Here the selected style is the predefined column style "SanFrancisco"
      String style = "column/SanFrancisco";
      chart.LoadStyle( style );

      chart.SetWidth( 400 );
      chart.SetHeight( 200 );
      chart.SetLooping( false );

      chart.SetOutputFormat("SWF");
      chart.ExportAsResponse();
      }
    catch( Exception e )
      {
      out.println( e );
      }
    }
}
| References: |
| Keywords: | Servlet JSP Java Column Chart |