SAMPLE: Simple XY Line Chart - ASP.NET
The information in this article applies to:
- Swiff Chart Generator 3
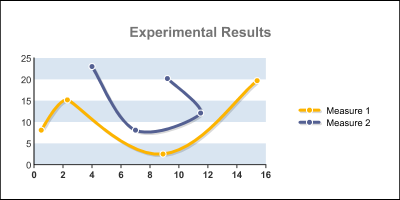
This example illustrates how to generate a simple XY line chart in ASP.NET
using System;
using System.Data;
using System.Configuration;
using System.Collections;
using System.Web;
using System.Web.Security;
using System.Web.UI;
using System.Web.UI.WebControls;
using System.Web.UI.WebControls.WebParts;
using System.Web.UI.HtmlControls;
using GlobFX.SwiffChartGenerator;
public partial class CSharp_QuickStarts_XYLine : System.Web.UI.Page
{
protected void Page_Load(object sender, EventArgs e)
{
// Set the heading for the graph
chart.Title= "Experimental Results";
// Set chart categories
chart.SetCategoriesFromArray( new string[] { "Q1", "Q2", "Q3" } );
// Fill the first series named "Measure 1"
chart.SetSeriesCaption( 0, "Measure 1" );
chart.SetSeriesXValuesFromArray( 0, new double[] { 0.5, 2.3, 8.9, 15.4 } );
chart.SetSeriesYValuesFromArray( 0, new double[] { 8.1, 15.2, 2.5, 19.7 } );
// Fill the second series named "Measure 2"
chart.SetSeriesCaption( 1, "Measure 2" );
chart.SetSeriesXValuesFromArray( 1, new double[] { 4.0, 7.0, 11.5, 9.2 } );
chart.SetSeriesYValuesFromArray( 1, new double[] { 23.0, 8.1, 12.1, 20.2 } );
// Apply an XY (Scatter) style
// The chart type is stored in the style file (*.scs)
// Here the selected style is the predefined XY line style "Honolulu"
chart.LoadStyle( @"xy\Honolulu" );
chart.Looping= false;
}
}
| Keywords: | ASP.NET XY Line |