SAMPLE: Simple Column Chart - ASP
The information in this article applies to:
- Swiff Chart Generator 2
- Swiff Chart Generator 3
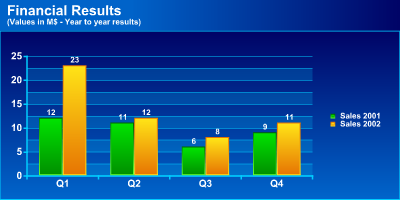
This example illustrates how to generate a simple column chart in ASP.
<% @Language=VBScript %>
<%
  Response.Expires= 0

  Dim chart

  Set chart= Server.CreateObject("SwiffChartObject.ChartObj")

  ' Fill the categories
  chart.SetCategoriesFromString "Q1;Q2;Q3;Q4"

  ' Fill the first series named "Sales Y1"
  chart.SetSeriesValuesFromString 0, "9;6;11;12"
  chart.SetSeriesCaption 0, "Sales Y1"

  ' Fill the second series named "Sales Y2"
  chart.SetSeriesValuesFromString 1, "11;8;12;23"
  chart.SetSeriesCaption 1, "Sales Y2"

  ' Set the chart title
  chart.SetTitle "Financial Results"
  chart.SetSubtitle "(Values in M$ - Year to year results)"

  ' Apply a Column style
  ' The chart type is stored in the style file (*.scs)
  ' Here the selected style is the predefined column style "SanFrancisco"
  chart.LoadStyle "column/SanFrancisco"

  chart.SetLooping false

  chart_res= chart.GetHTMLTag

  Set chart= Nothing
%>

<H1>Column Chart</H1>
<br><%=chart_res%>
| Keywords: | ASP Column Chart |