|
Swiff Chart Generator Demos
Chart | ASP.NET - C# | ASP.NET - VB | ASP | PHP | JSP |
|
using System;
using System.Data;
using System.Configuration;
using System.Collections;
using System.Web;
using System.Web.Security;
using System.Web.UI;
using System.Web.UI.WebControls;
using System.Web.UI.WebControls.WebParts;
using System.Web.UI.HtmlControls;
using GlobFX.SwiffChartGenerator;
public partial class SwiffChartGeneratorSample : System.Web.UI.Page
{
protected void Page_Load(object sender, EventArgs e)
{
// Set chart categories
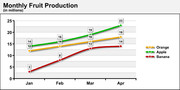
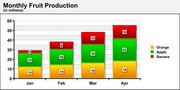
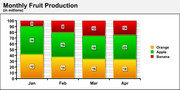
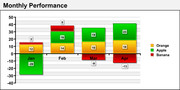
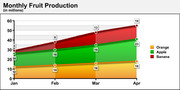
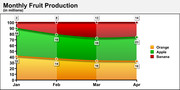
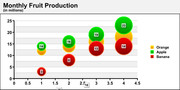
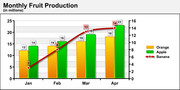
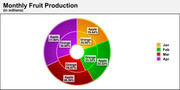
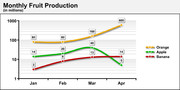
chart.SetCategoriesFromArray( new string[] { "Jan", "Feb", "Mar", "Apr" } );
// Fill the first series named "Orange"
chart.SetSeriesCaption( 0, "Orange" );
chart.SetSeriesValuesFromArray( 0, new double[] { 12, 14, 16, 18 } );
// Fill the second series named "Apple"
chart.SetSeriesCaption( 1, "Apple" );
chart.SetSeriesValuesFromArray( 1, new double[] { 14, 16, 19, 23 } );
// Fill the third series named "Banana"
chart.SetSeriesCaption( 2, "Banana" );
chart.SetSeriesValuesFromArray( 2, new double[] { 3, 8, 13, 14 } );
// Set the chart title
chart.Title= "Monthly Fruit Production";
chart.Subtitle= "(in millions)";
// Apply a Column style (*.scs) designed with Swiff Chart
// The chart type is stored in the style file
chart.LoadStyle( Server.MapPath("simple-cols-stacked100.scs") );
chart.OutputFormat= OutputFormat.Svg;
}
}Imports GlobFX.SwiffChartGenerator
Partial Class SwiffChartGeneratorSample
Inherits System.Web.UI.Page
Protected Sub Page_Load(ByVal sender As Object, ByVal e As System.EventArgs) Handles Me.Load
' Set chart categories
chart.SetCategoriesFromArray(New String() {"Jan", "Feb", "Mar", "Apr"})
' Fill the first series named "Orange"
chart.SetSeriesCaption(0, "Orange")
chart.SetSeriesValuesFromArray(0, New Double() {12, 14, 16, 18})
' Fill the second series named "Apple"
chart.SetSeriesCaption(1, "Apple")
chart.SetSeriesValuesFromArray(1, New Double() {14, 16, 19, 23})
' Fill the third series named "Banana"
chart.SetSeriesCaption(2, "Banana")
chart.SetSeriesValuesFromArray(2, New Double() {3, 8, 13, 14})
' Set the chart title
chart.Title = "Monthly Fruit Production"
chart.Subtitle = "(in millions)"
' Apply a Column style (*.scs) designed with Swiff Chart
' The chart type is stored in the style file
chart.LoadStyle(Server.MapPath("simple-cols-stacked100.scs"))
chart.OutputFormat = OutputFormat.Svg
End Sub
End Class<!DOCTYPE HTML PUBLIC "-//W3C//DTD HTML 4.01 Transitional//EN" "http://www.w3.org/TR/html4/loose.dtd">
<html>
<head>
<title>Swiff Chart Generator Sample</title>
</head>
<body>
<% @Language=VBScript %>
<%
Response.Expires= 0
Dim chart
Set chart= Server.CreateObject("SwiffChartObject.ChartObj")
' Fill the categories
chart.SetCategoriesFromString "Jan;Feb;Mar;Apr"
' Fill the first series named "Orange"
chart.SetSeriesCaption 0, "Orange"
chart.SetSeriesValuesFromString 0, "12;14;16;18"
' Fill the second series named "Apple"
chart.SetSeriesCaption 1, "Orange"
chart.SetSeriesValuesFromString 1, "14;16;19;23"
' Fill the third series named "Banana"
chart.SetSeriesCaption 2, "Banana"
chart.SetSeriesValuesFromString 2, "3;8;13;14"
' Set the chart title
chart.SetTitle "Monthly Fruit Production"
chart.SetSubtitle "(in millions)"
' Apply a Column style (*.scs) designed with Swiff Chart
' The chart type is stored in the style file
chart.LoadStyle Server.MapPath("simple-cols-stacked100.scs")
chart.SetOutputFormat "svg"
Response.Write chart.GetHTMLTag
Set chart= Nothing
%>
</body>
</html><!DOCTYPE HTML PUBLIC "-//W3C//DTD HTML 4.01 Transitional//EN" "http://www.w3.org/TR/html4/loose.dtd">
<html>
<head>
<title>Swiff Chart Generator Sample</title>
</head>
<body>
<?php
$install_dir= "/usr/local/SwiffChart";
require("$install_dir/resources/php/SwiffChart.php");
$chart= new SwiffChart($install_dir);
// Set chart categories
$chart->SetCategoriesFromArray( array( "Jan", "Feb", "Mar", "Apr" ) );
// Fill the first series named "Orange"
$chart->SetSeriesCaption( 0, "Orange" );
$chart->SetSeriesValuesFromArray( 0, array( 12, 14, 16, 18 ) );
// Fill the second series named "Apple"
$chart->SetSeriesCaption( 1, "Apple" );
$chart->SetSeriesValuesFromArray( 1, array( 14, 16, 19, 23 ) );
// Fill the third series named "Banana"
$chart->SetSeriesCaption( 2, "Banana" );
$chart->SetSeriesValuesFromArray( 2, array( 3, 8, 13, 14 ) );
// Set the chart title
$chart->SetTitle( "Monthly Fruit Production" );
$chart->SetSubtitle( "(in millions)" );
// Apply a Column style (*.scs) designed with Swiff Chart
// The chart type is stored in the style file
$chart->LoadStyle( "simple-cols-stacked100.scs" );
$chart->SetOutputFormat( "svg" );
print $chart->GetHTMLTag();
?>
</body>
</html><!DOCTYPE HTML PUBLIC "-//W3C//DTD HTML 4.01 Transitional//EN" "http://www.w3.org/TR/html4/loose.dtd">
<html>
<head>
<title>Swiff Chart Generator Sample</title>
</head>
<body>
<%@page language="java"%>
<%@page import="com.globfx.swiffchart.SwiffChart" %>
<%
String install_dir= "/usr/local/SwiffChart";
SwiffChart chart= new SwiffChart(install_dir);
chart.SetDocumentRoot( getServletContext().getRealPath("/") );
chart.SetAppRootUrl(request.getContextPath());
chart.SetServletInfo(request,response);
// Set chart categories
chart.SetCategoriesFromArray( new String[] { "Jan", "Feb", "Mar", "Apr" } );
// Fill the first series named "Orange"
chart.SetSeriesCaption( 0, "Orange" );
chart.SetSeriesValuesFromArray( 0, new double[] { 12, 14, 16, 18 } );
// Fill the second series named "Apple"
chart.SetSeriesCaption( 1, "Apple" );
chart.SetSeriesValuesFromArray( 1, new double[] { 14, 16, 19, 23 } );
// Fill the third series named "Banana"
chart.SetSeriesCaption( 2, "Banana" );
chart.SetSeriesValuesFromArray( 2, new double[] { 3, 8, 13, 14 } );
// Set the chart title
chart.SetTitle( "Monthly Fruit Production" );
chart.SetSubtitle( "(in millions)" );
// Apply a Column style (*.scs) designed with Swiff Chart
// The chart type is stored in the style file
chart.LoadStyle( getServletContext().getRealPath("simple-cols-stacked100.scs") );
chart.SetOutputFormat( "svg" );
out.println( chart.GetHTMLTag() );
chart.Release();
%>
</body>
</html>
|
Chart Types
|
Output Formats
|
|
|
|